Diffusion Model Response-Dynamics Attribution Diagram
Overview
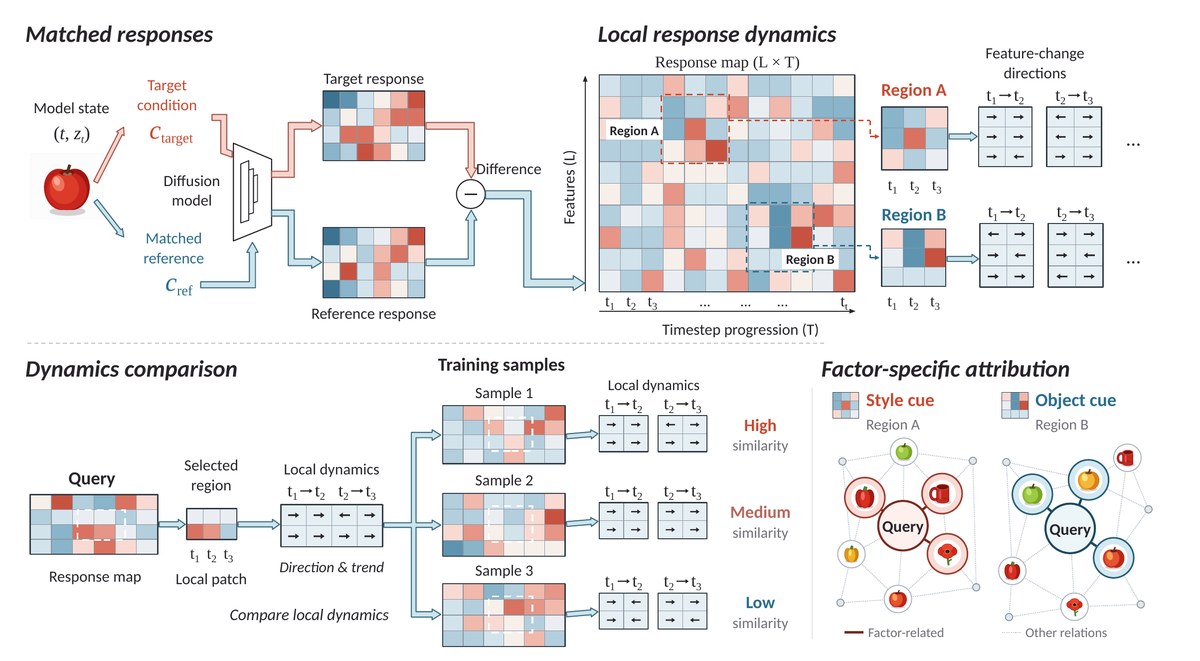
A four-part diagram of attributing how a diffusion model responds to a condition, not just which samples matter. It is an editable PowerPoint diagram adapted from the original paper figure under CC BY 4.0.
What the diagram shows
Matched responses: a model state (t, zt) (input image) runs through the diffusion model under a target condition ctarget and a matched reference cref, and the two response grids are subtracted. Local response dynamics: the difference forms a response map (features L × timesteps T) with dashed regions A and B, each zoomed into a 3 × 3 patch over t1, t2, t3 and turned into feature-change direction grids (t1 → t2, t2 → t3) of arrow cells. Dynamics comparison: a query response map → selected region (local patch) → local dynamics (direction & trend), compared with three training samples ranked high, medium and low similarity. Factor-specific attribution: two graphs around a query node, style cue (region A) and object cue (region B), with factor-related neighbours highlighted against other relations. Every box, arrow, label and math term is a native shape you can recolor, resize and relabel for your own slides, posters or papers.
File format
The download contains .pptx (1 slide, 14.95 × 8.22 in; opens in PowerPoint, Keynote, WPS and LibreOffice Impress; Google Slides works too, but complex freeforms may shift slightly), .svg and .drawio. Includes preview.png (full resolution) and a 1200 px web preview.
Shapes and editing
The file has 746 native editable shapes: 497 auto-shapes, 87 text boxes, 97 freeforms, 65 lines/connectors (13 small groups). No embedded images. Everything is vector. You can edit all text and math ((t, zt), ctarget, cref, L, T, t1 … tt, t1 → t2, t2 → t3), every cell of the response grids and the large response map, the dashed region outlines and callout links, the diffusion-model block, the ⊖ difference node, the block arrows, every arrow cell of the direction grids, the similarity labels, both attribution graphs with their nodes, rings and edges, the legend and the placeholder object icons.
Embedded images and fonts
This file has no embedded images; everything is vector. The input image and the 12 object thumbnails in the attribution graphs are simplified flat vector placeholder icons (an apple, peppers, mugs and flowers built from basic shapes), not photos; paste your own images over them if you need real samples. Body text uses Calibri and formulas use Times New Roman. Calibri ships with Microsoft Office and Times New Roman is preinstalled on Windows and macOS (LibreOffice substitutes the metric-compatible Carlito and Liberation Serif). Sub- and superscripts are real formatted text runs, not equation objects. The SVG keeps text as text; the draw.io file is a shape-by-shape conversion and may need small nudges. This is a faithful redraw for reuse, not the authors' original source file.
Source & license Adapted from Figure 1 of Attributing HOW, Not Just WHICH: Counterfactual Response Trajectories for Diffusion Models by Haoqian Zhang, Ziyuan Yang, Zerui Shao, Yi Zhang (arXiv:2610.11238, https://arxiv.org/abs/2610.11238). Licensed under CC BY 4.0 (https://creativecommons.org/licenses/by/4.0/). Redrawn as editable shapes; changes made by 叫我Alonzo就好了/alonzolab. Not endorsed by the original authors.
Questions or feedback? Email [email protected]