Graph-Prior Time-Series Anomaly Detection Diagram
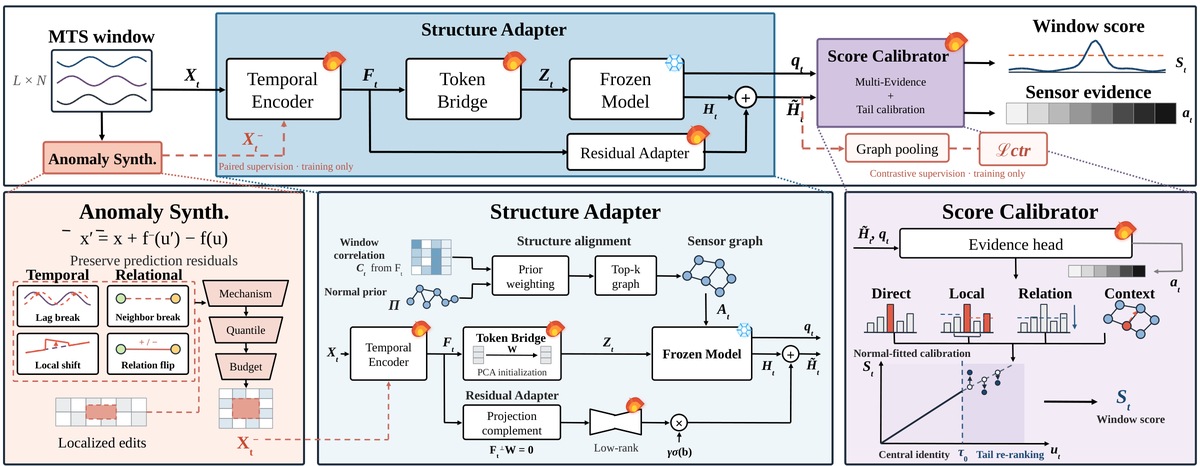
Temporal and relational perturbations, sparse sensor graphs, evidence heads and calibration support anomaly detection.
File format
One native editable PowerPoint slide (.pptx), plus SVG and shape-based draw.io exports; preview.png and preview-1200.jpg. PowerPoint is the primary editing format. SVG/draw.io layout and font rendering may need small adjustments. SVG previews may rasterize generated shadow effects; no original source photographs are embedded in the editable PPTX.
Editing and source imagery
The PPTX contains 547 native shapes and no embedded media. Original photographs, video frames, GUI screens and data-derived imagery have been replaced with independently drawn vector placeholders. Useful functional labels remain; paper-specific method names have been generalized. Text specifies Times New Roman; preview rendering may substitute Tinos.
This is a redrawn reusable mechanism figure, not the original authors' source file. Use remains subject to Figkit's existing product terms. Source-paper attribution is required for public use; retain LICENSE-ATTRIBUTION.txt.
Source & license
Adapted diagram, not an official paper asset. Source: Graph Foundation Models Can Become Effective Multivariate Time Series Anomaly Detectors Authors: Hu, Zhuangyan; Liang, Zhuoxuan; Li, Wei; Jia, Xiaohua; Youssef, Moustafa; Helal, Sumi https://arxiv.org/abs/2611.06441 Figure 2 License: Creative Commons Attribution 4.0 International https://creativecommons.org/licenses/by/4.0/ Changes: independently rebuilt as native editable shapes; method names generalized; all photo/video/GUI/data-derived imagery replaced with original vector placeholders; typography standardized to Times New Roman. Attribution is required for public use. Original image appears only in internal compare.png for review, not in the editable deliverables.
Questions or feedback? Email [email protected]