Hierarchical Pose-Graph 3D Reconstruction Pipeline Diagram (Editable PowerPoint)
Overview
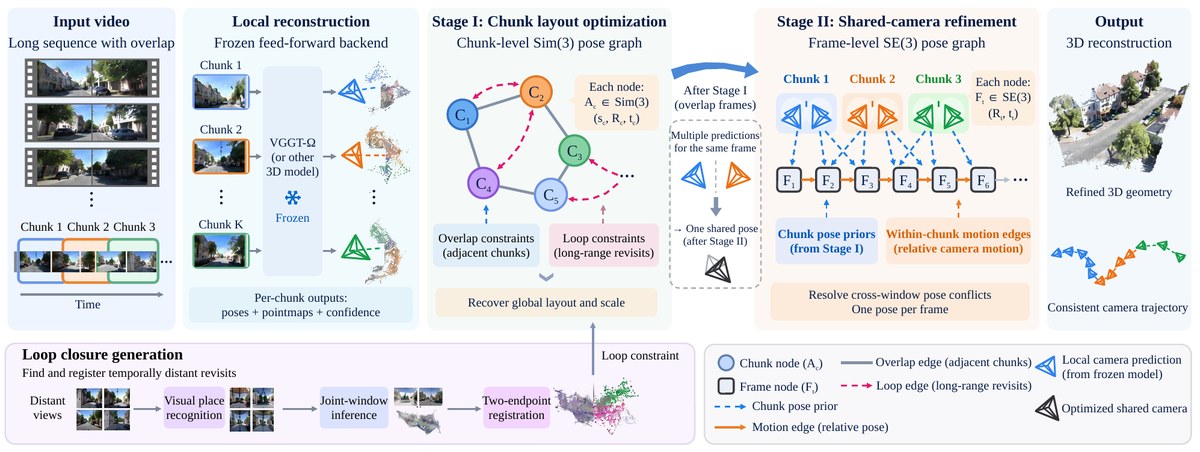
This editable PowerPoint diagram shows a two-stage hierarchical pose-graph pipeline for long-video 3D reconstruction. It is adapted from the original paper figure under CC BY 4.0.
What the diagram shows
The pipeline runs from left to right. A long input video is split into overlapping chunks and passed to a frozen feed-forward reconstruction backend, which produces per-chunk poses, pointmaps and confidence. Stage I builds a chunk-level Sim(3) pose graph with overlap and loop constraints. Stage II performs frame-level SE(3) shared-camera refinement with chunk pose priors and within-chunk motion edges, leading to the 3D reconstruction output. Underneath sit a loop-closure sub-pipeline (visual place recognition, joint-window inference and two-endpoint registration) and a full node and edge legend. Panels, graph nodes, solid and dashed edges, camera-frustum icons, the film strip, the snowflake and every label are native shapes, ready to restyle for your own slides, posters or papers.
File format
The download is a single-slide .pptx file measuring 11.53 × 4.34 in. It opens in PowerPoint, Keynote, WPS and LibreOffice Impress. Google Slides works too, although complex freeforms may shift slightly. A full-resolution preview.png and a 1200 px web preview are included.
Shapes and editing
The file has 382 elements in total: 353 native editable shapes (101 auto-shapes, 100 lines or connectors, 90 freeforms and 62 text boxes) and 29 embedded raster images. You can edit all text, including the Sim(3) and SE(3) node definitions with their sub- and superscripts, the C1…C5 and F1…F6 graph nodes, the overlap, loop, prior and motion edges, and every camera-frustum icon (local predictions and optimized shared cameras, also in the output trajectory). The film-strip frame, chunk brackets, timeline, stage panels and legend are editable too.
Embedded images and fonts
The 29 embedded PNG images are the 6 film-strip video frames, the 4 timeline thumbnails, the 3 chunk thumbnails, the 3 per-chunk point clouds, the output 3D reconstruction and 12 small images in the loop-closure row (distant views, place-recognition matches, joint-window frames and two point clouds). Point clouds and the mesh have transparent backgrounds. All are at the source figure's resolution (small thumbnails, roughly 150–180 px per inch), so swap in your own images for large prints. The text uses Times New Roman; without it, your app substitutes a similar serif. Sub- and superscripts are formatted text runs, not equation objects. This is a faithful redraw for reuse, not the authors' original source file.
Source & license Adapted from Figure 2 of HiP3R: Hierarchical Pose Graphs for Long-Horizon 3D Reconstruction by Zunnan Xu, Shangchen Zhou, Yihang Luo, Chen Change Loy (arXiv:2610.31635, https://arxiv.org/abs/2610.31635; code: https://github.com/HiP3Rs/HiP3R). The original is licensed under CC BY 4.0 (https://creativecommons.org/licenses/by/4.0/). Converted to editable PowerPoint shapes; changes made by 叫我Alonzo就好了/alonzolab. Not endorsed by the original authors. Please keep the attribution (see LICENSE-ATTRIBUTION.txt) when you reuse the figure.