High-Resolution DiT Coarse-to-Fine Attention Diagram
Overview
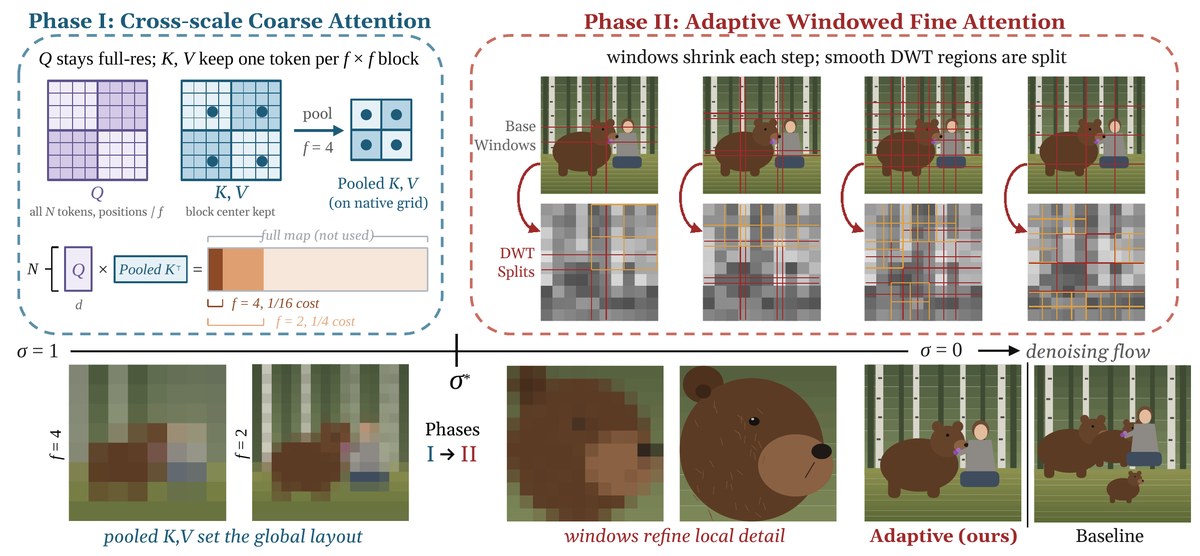
A two-phase diagram of efficient attention for a high-resolution diffusion transformer, laid out along the denoising axis from σ = 1 through the switch point σ* to σ = 0. It is an editable PowerPoint diagram adapted from the original paper figure under CC BY 4.0.
What the diagram shows
Phase I, cross-scale coarse attention: Q stays at full resolution while K, V keep one token per f × f block (block centre kept, pooled on the native grid with f = 4); the N × d query times Pooled K⊤ gives a narrow score strip instead of the full map, at 1/16 cost for f = 4 and 1/4 for f = 2. Phase II, adaptive windowed fine attention: four denoising steps of base windows over generated images, with smooth wavelet (DWT) regions split into finer windows at each step. A bottom result strip shows f = 4 and f = 2 coarse outputs, two zoomed detail crops, the final adaptive result and a baseline for comparison. Every box, arrow, label and math term is a native shape you can recolor, resize and relabel for your own slides, posters or papers.
File format
The download contains .pptx (1 slide, 15.47 × 7.17 in; opens in PowerPoint, Keynote, WPS and LibreOffice Impress; Google Slides works too, but complex freeforms may shift slightly), .svg and .drawio. Includes preview.png (full resolution) and a 1200 px web preview.
Shapes and editing
The file has 1656 native editable shapes: 1433 auto-shapes, 35 text boxes, 18 freeforms, 170 lines/connectors (14 small groups). No embedded images. Everything is vector. You can edit all text and math (Q, K, V, f × f, Pooled K⊤, N, d, σ = 1, σ*, σ = 0), the Q and K, V token grids with block-centre dots, the pooled 2 × 2 grid, the cost strip with f = 4 / f = 2 brackets, the vector placeholder scenes and every red base-window and orange split line drawn over them, curved step arrows, both dashed phase panels, the denoising axis and the baseline divider.
Embedded images and fonts
This file has no embedded images; everything is vector. The 4 generation steps and 4 wavelet-detail maps in Phase II and the 6 result thumbnails are simplified vector placeholder scenes: a flat forest scene, grey block maps and colour mosaics for the pooled previews. Paste your own images over them if you need real samples. Body text uses Georgia and formulas use Times New Roman; both are preinstalled on Windows and macOS (LibreOffice substitutes the metric-compatible Gelasio and Liberation Serif). Sub- and superscripts are real formatted text runs, not equation objects. The SVG keeps text as text; the draw.io file is a shape-by-shape conversion and may need small nudges. This is a faithful redraw for reuse, not the authors' original source file.
Source & license Adapted from Figure 4 of AReA: Adaptive Receptive-Field Attention for Efficient High-Resolution Diffusion Transformers by Javad Rajabi, Koorosh Roohi, David B. Lindell, Babak Taati (arXiv:2610.17227, https://arxiv.org/abs/2610.17227). Licensed under CC BY 4.0 (https://creativecommons.org/licenses/by/4.0/). Redrawn as editable shapes; changes made by 叫我Alonzo就好了/alonzolab. Not endorsed by the original authors.
Questions or feedback? Email [email protected]