VLM Test-Time Sampling Likelihood-Landscape Diagram
Overview
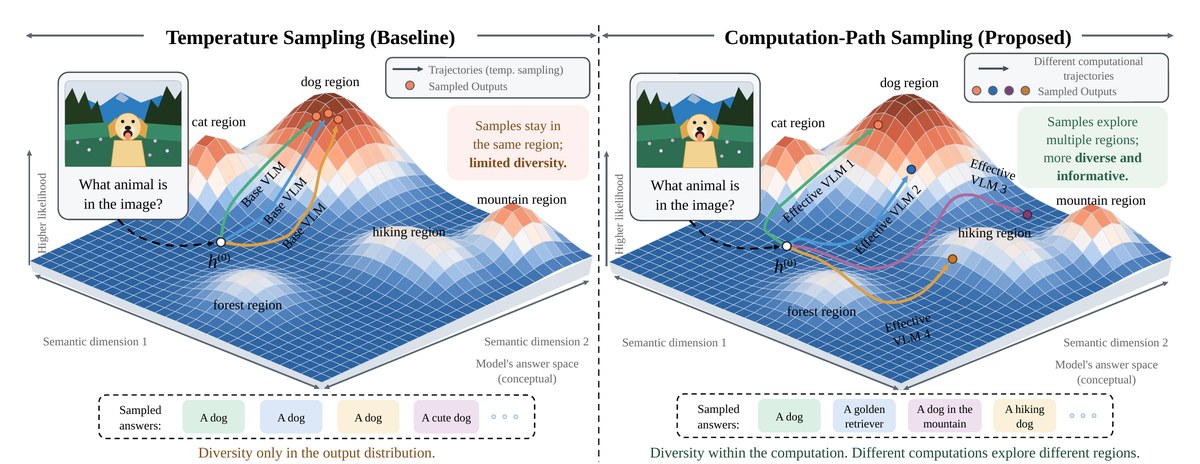
A side-by-side conceptual diagram of two ways to get diverse answers from a vision-language model at test time. It is an editable PowerPoint diagram adapted from the original paper figure under CC BY 4.0.
What the diagram shows
Each half shows a 3D likelihood landscape (a shaded quad-mesh surface over semantic dimensions 1 and 2, with a higher-likelihood axis) whose peaks are labelled dog, cat, mountain, hiking and forest regions; an image-question card ("What animal is in the image?") feeds the starting state h(0) through a dashed arrow. Temperature sampling (baseline): three "Base VLM" trajectories climb the same dog peak, a legend marks trajectories and sampled outputs, a soft coral callout says the samples stay in the same region, and the sampled-answers strip reads A dog / A dog / A dog / A cute dog. Computation-path sampling (proposed): four "Effective VLM 1–4" trajectories in different colours end on different peaks with coloured output dots, a green callout says the samples explore multiple regions, and the answers strip reads A dog / A golden retriever / A dog in the mountain / A hiking dog. Header arrows, a dashed centre divider and a one-line caption under each half complete the comparison. Every box, arrow, label and math term is a native shape you can recolor, resize and relabel for your own slides, posters or papers.
File format
The download contains .pptx (1 slide, 15.26 × 5.90 in; opens in PowerPoint, Keynote, WPS and LibreOffice Impress; Google Slides works too, but complex freeforms may shift slightly), .svg and .drawio. Includes preview.png (full resolution) and a 1200 px web preview.
Shapes and editing
The file has 1748 native editable shapes: 64 auto-shapes, 49 text boxes, 1622 freeforms, 13 lines/connectors (4 small groups). No embedded images. Everything is vector. You can edit all text and math (h(0)), every quad of both likelihood surfaces and their base shadows, the axis arrows and labels, the region labels, the image-question cards and their placeholder photos, the dashed input arrows, every trajectory curve with its arrowhead and label, the start and output dots, both legends, the two callouts, the sampled-answer chips and dashed strips, the header arrows, the centre divider and the caption lines.
Embedded images and fonts
This file has no embedded images; everything is vector. Each likelihood surface is a native mesh of small four-sided freeforms (784 per surface), so it recolours and scales as vector but is heavy to edit quad by quad; each surface is grouped so you can move or resize it in one go. The photo in each question card is a simplified flat vector placeholder (sky, ridge, trees, meadow and a cartoon dog), not the paper's photo; paste your own image over it if you need a real sample. All text, body and formulas alike, uses Times New Roman, which is preinstalled on Windows and macOS (LibreOffice substitutes the metric-compatible Liberation Serif). Sub- and superscripts are real formatted text runs, not equation objects. The SVG keeps text as text; the draw.io file is a shape-by-shape conversion and may need small nudges. This is a faithful redraw for reuse, not the authors' original source file.
Source & license Adapted from Figure 1 of Architectural Sampling: Test-Time Scaling via Computational Diversity in Frozen Vision-Language Models by Akshit Singh, Shyam Marjit, Wei Lin, Leonid Karlinsky, M. Jehanzeb Mirza (arXiv:2610.01687, https://arxiv.org/abs/2610.01687). Licensed under CC BY 4.0 (https://creativecommons.org/licenses/by/4.0/). Redrawn as editable shapes; changes made by 叫我Alonzo就好了/alonzolab. Not endorsed by the original authors.
Questions or feedback? Email [email protected]